PAM-2500
Version:
High-performance Field and Laboratory Chlorophyll Fluorometer
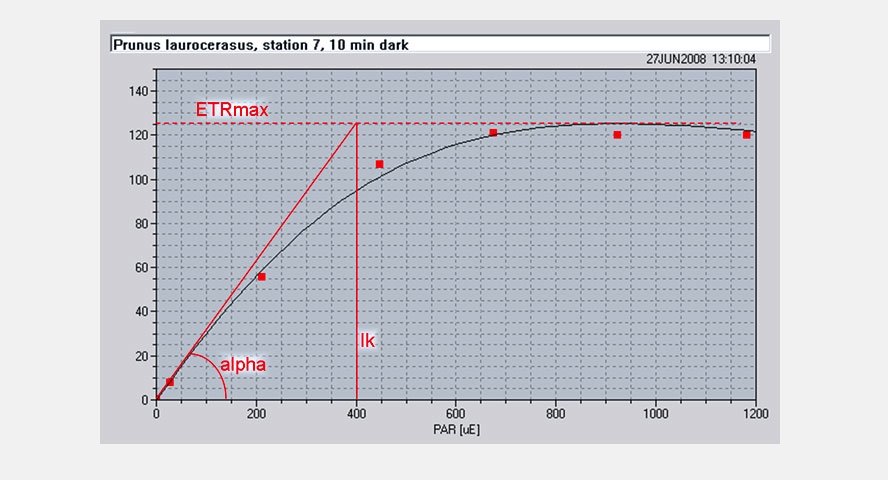
Light Saturation Curves of the Apparent Electron Transport Rate
A major application of PAM-2500 fluorometers in ecophysiology is the fast and reliable analysis of the photosynthetic performance of plants.
Two important parameters for characterizing photosynthesis are the maximum quantum yield for whole chain electron transport (“alpha”, at low light intensities) and the maximum electron transport capacity (“ETRmax”, at light saturation).
To evaluate the alpha and ETRmax, apparent electron transport rates (ETR) are derived from effective quantum yields of photosystem II (ΔF/Fm' or Y(II)) according to ETR = Y(II) x PAR x 0.42.
In this equation, the PAR corresponds to the quantum flux density of photosynthetically active radiation, and the 0.42 is the product of light absorptance by an average green leaf (0.84) times the fraction of absorbed quanta available for photosystem II (0.5).
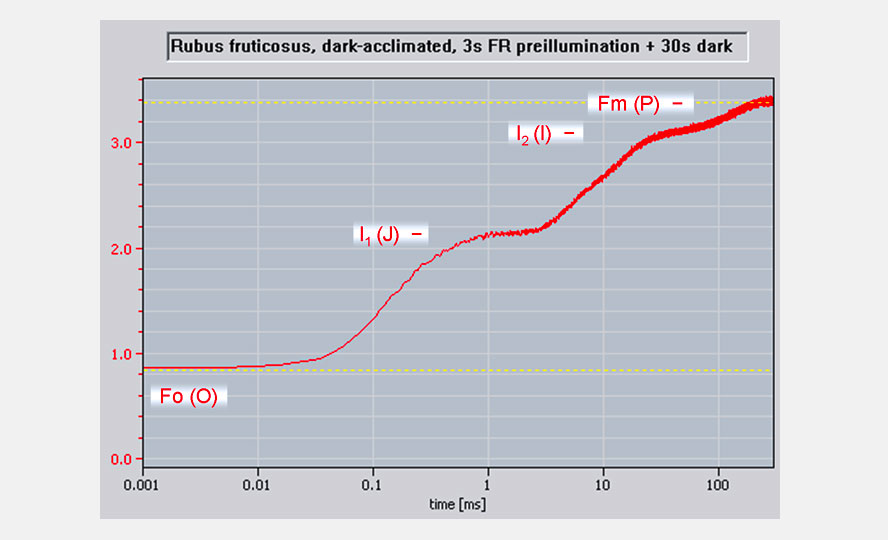
Polyphasic Fluorescence Rise Upon Onset of Saturating Light
The fast acquisition mode of the PAM-2500 enables recording of rapid fluorescence kinetics with 10 µs time resolution. This high time resolution is achieved with pulse modulated signals.
This means that the fast kinetics of fluorescence yield is measured and, consequently, that signal amplitudes from different experiments can be directly compared irrespective of light intensity and sample geometry.
The same saturating light that serves for saturation pulses can also be used for measuring the polyphasic fluorescence rise kinetics. This type of kinetics provides valuable information on the properties of PS II and the state of its primary and secondary acceptor pools.
With a dark-acclimated sample, four characteristic levels of fluorescence yield can be distinguished in a plot with logarithmic time scale: Fo, I1, I2 and Fm (alternatively also denoted O, J, I and P).