Products & Accessories


Accessory
Photosynthetic Light Reactions
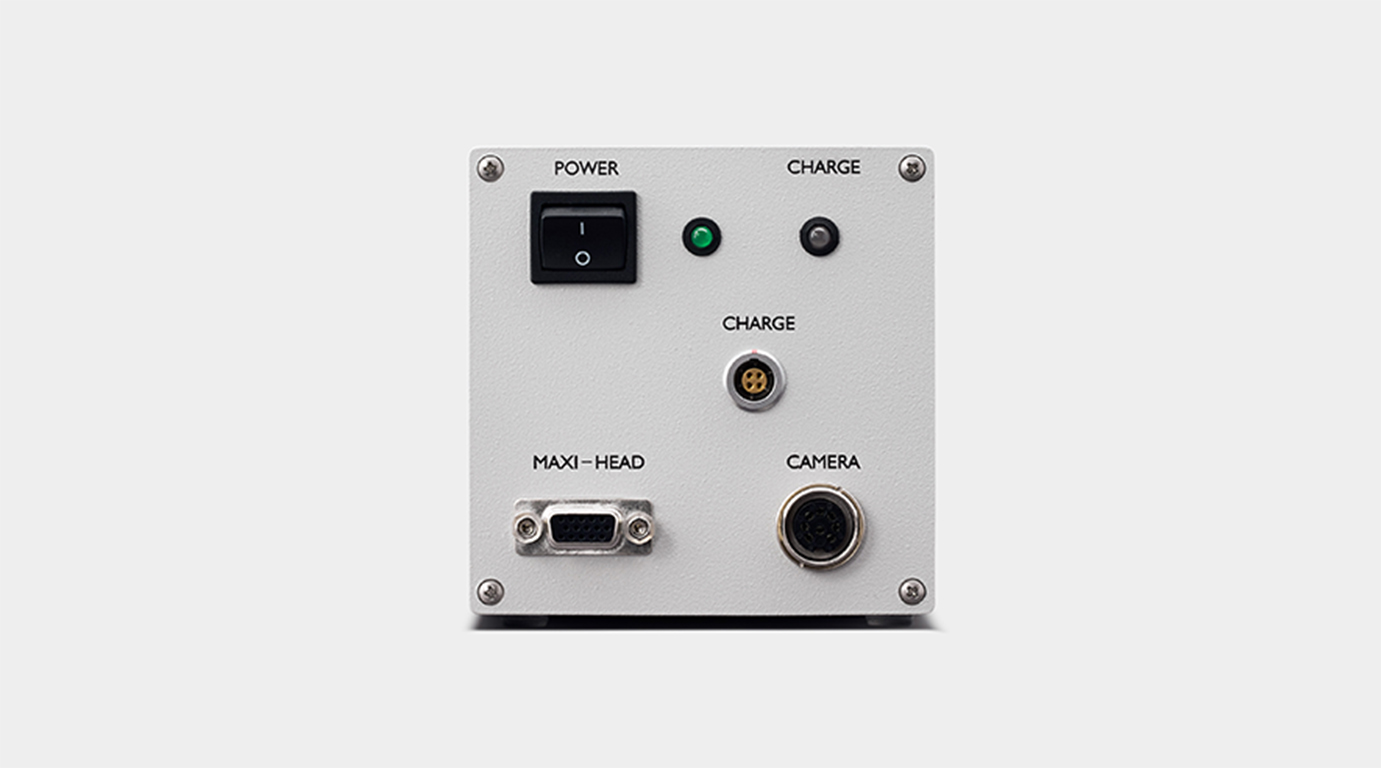
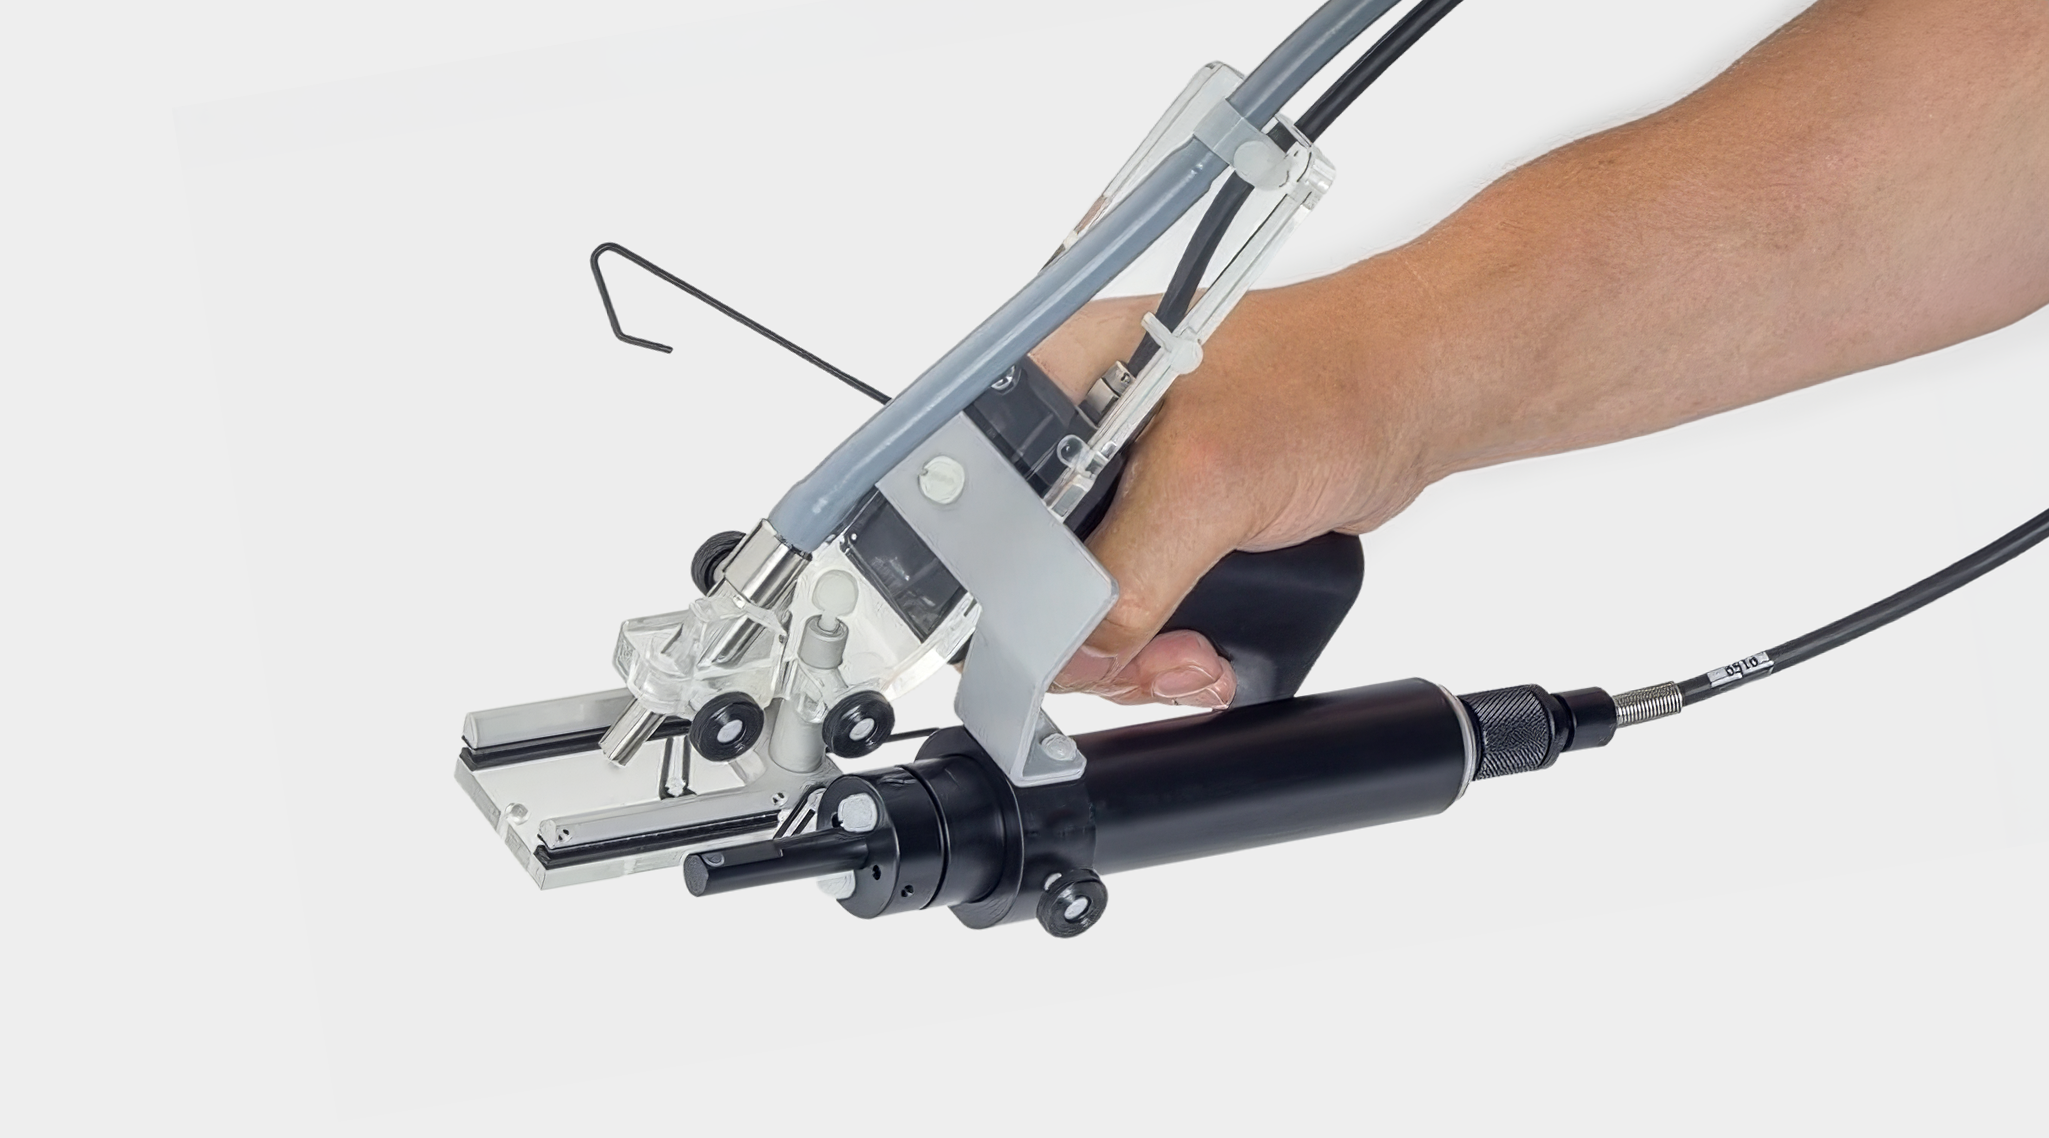
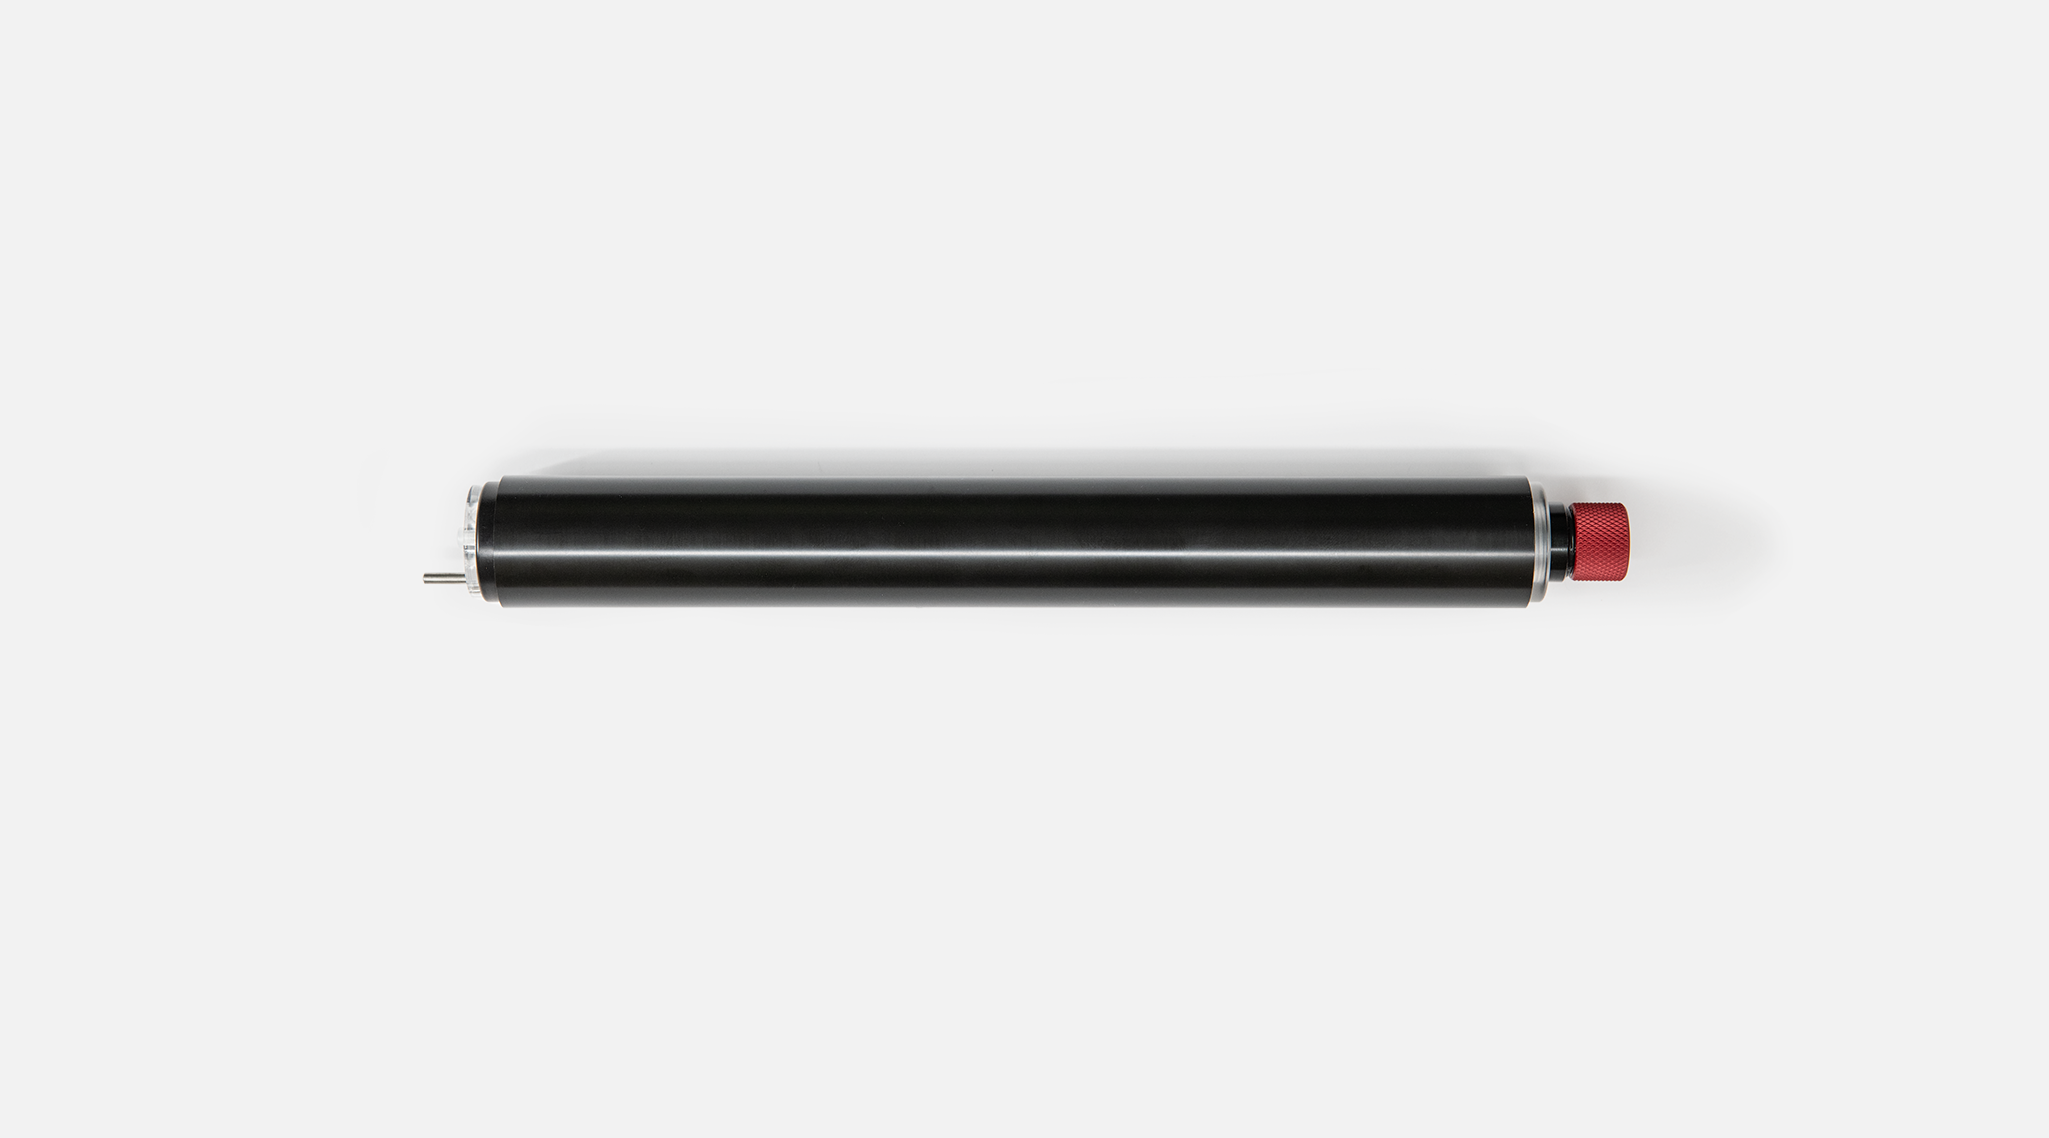
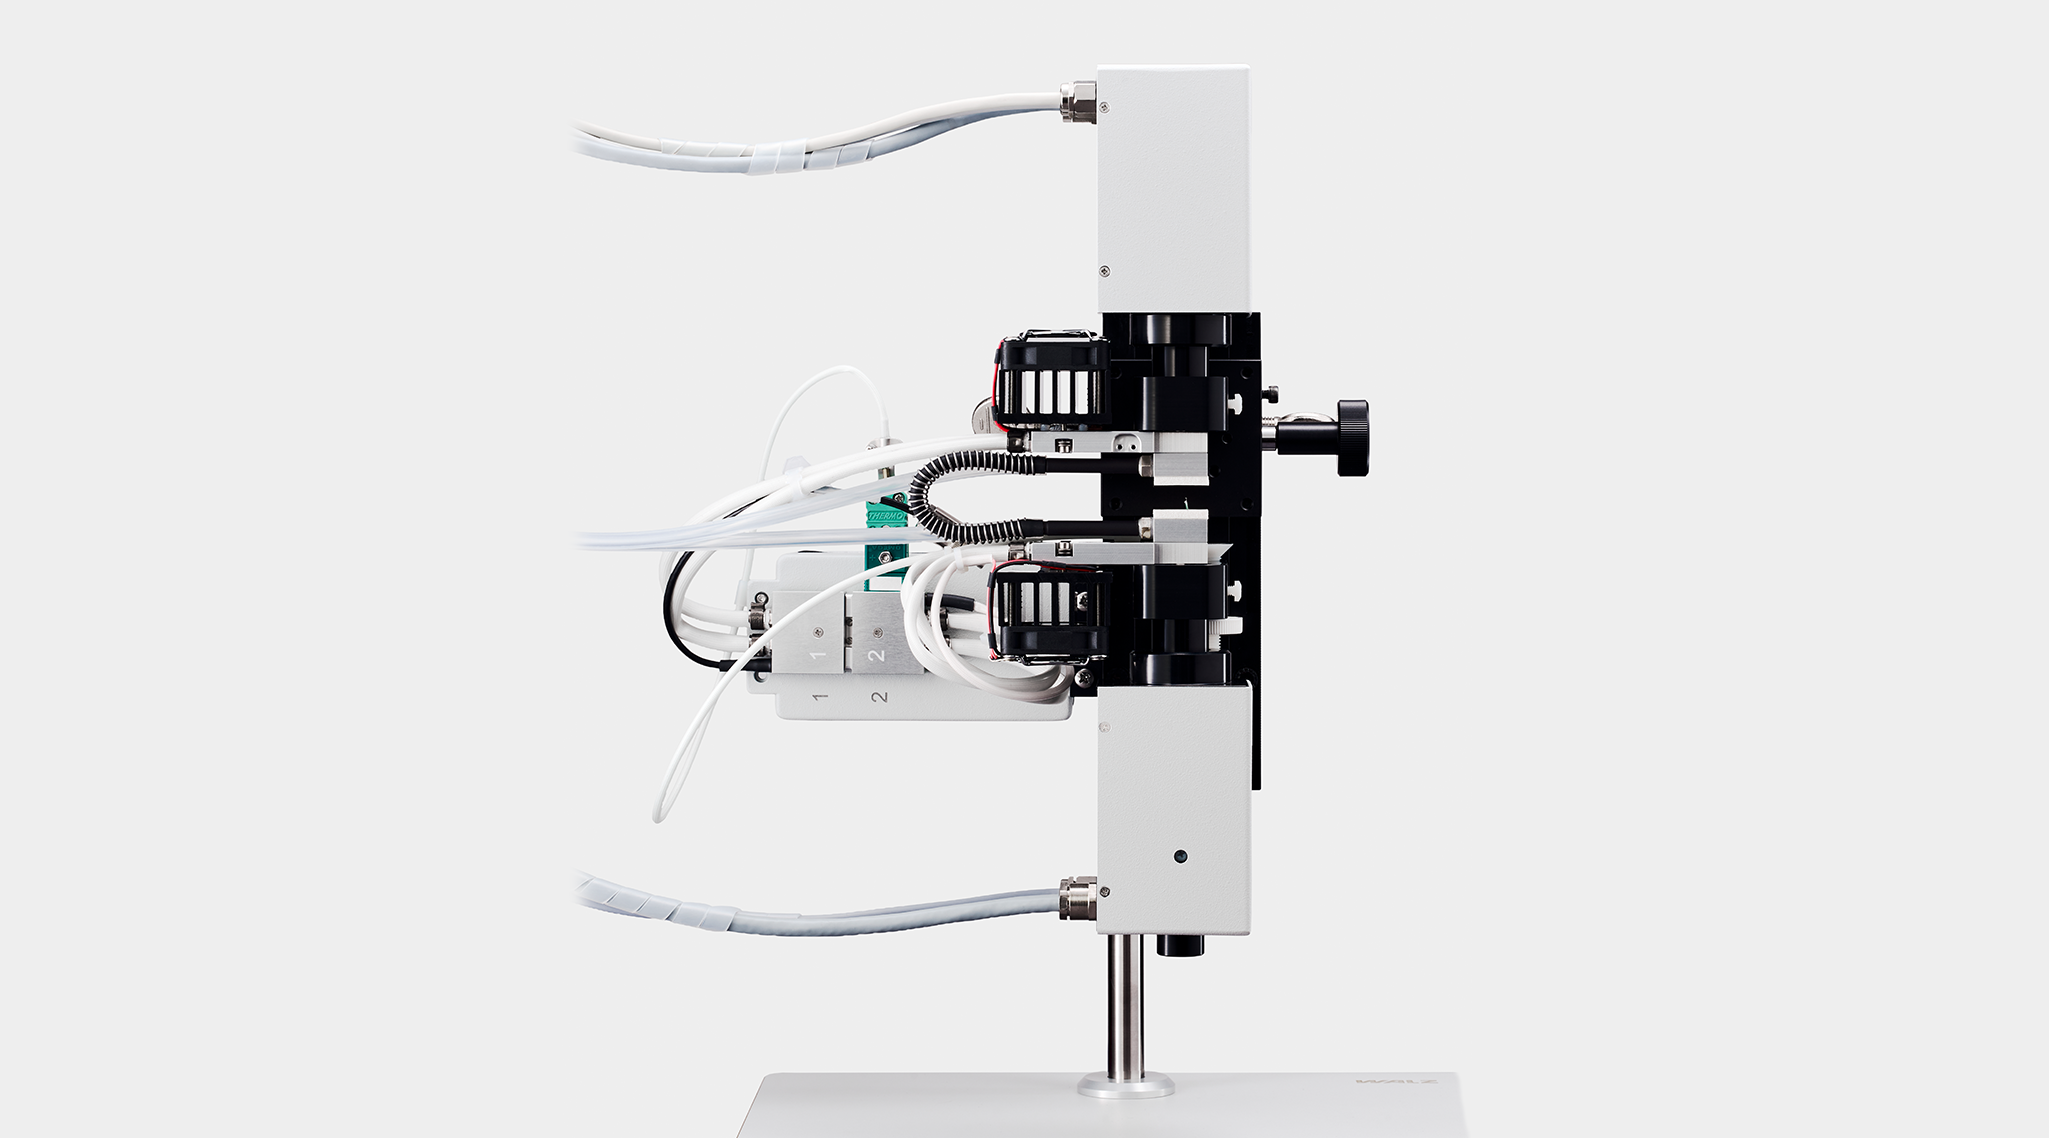
ED-101US/T
Temperature Control Block
Field
Water
Laboratory


Accessory
Photosynthetic Light Reactions
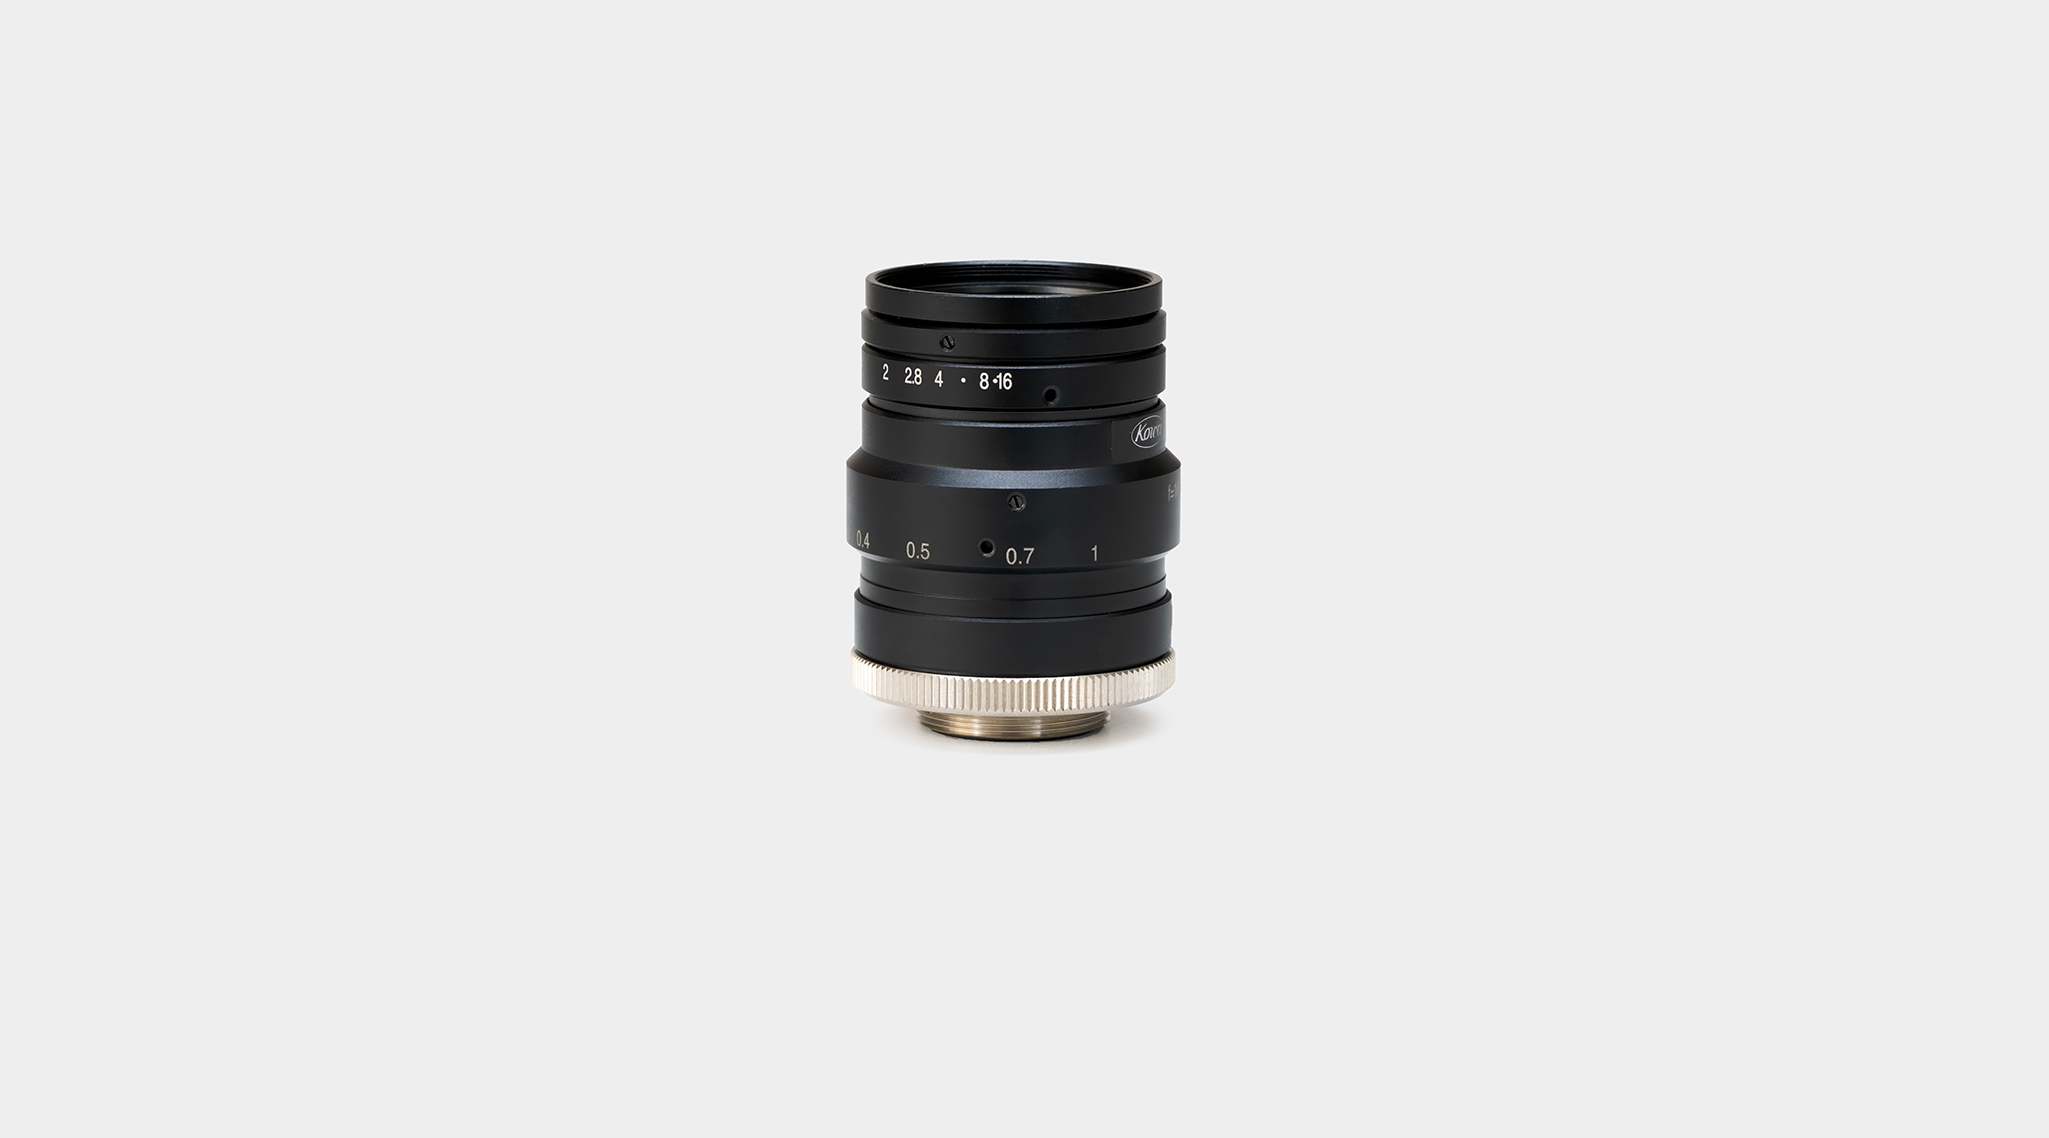
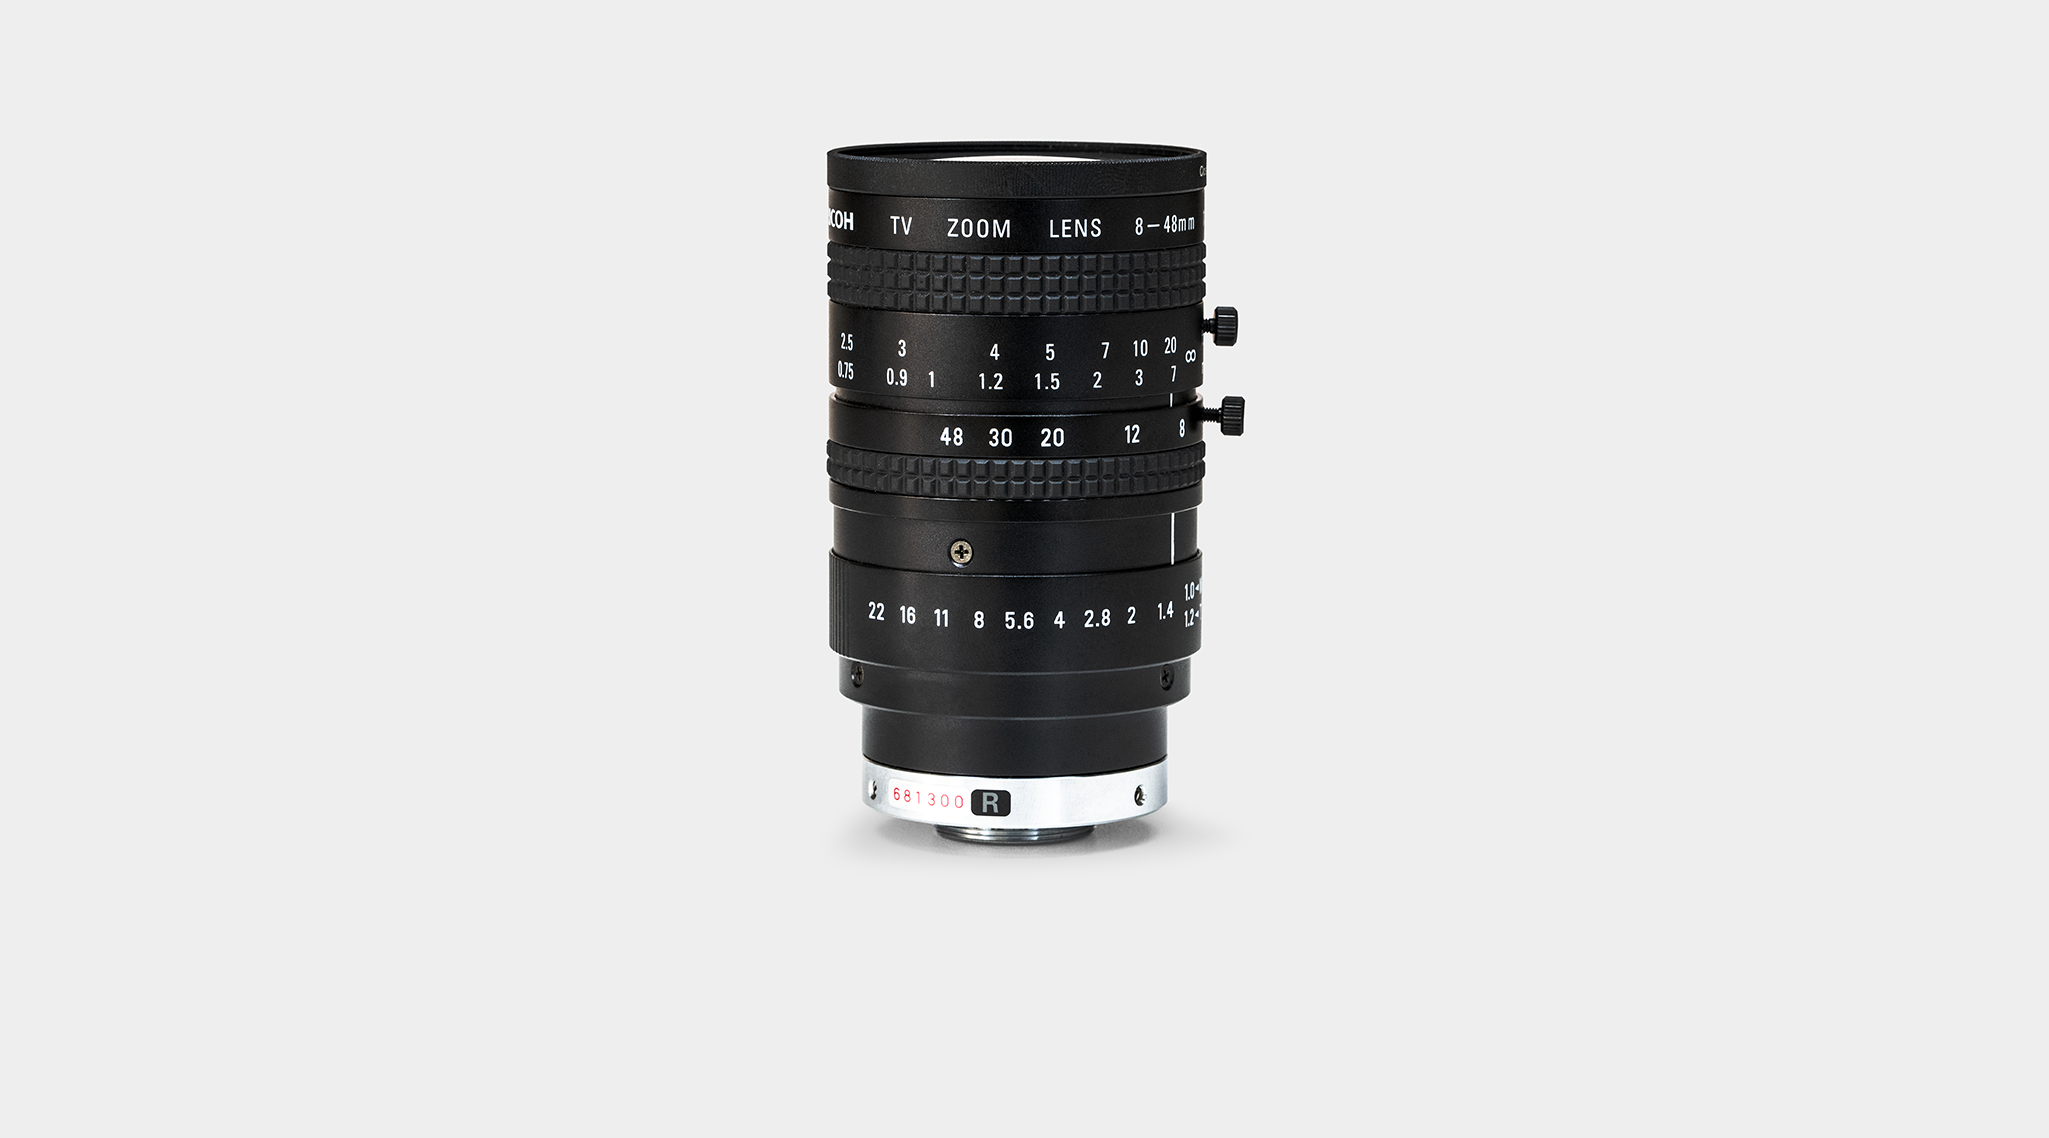
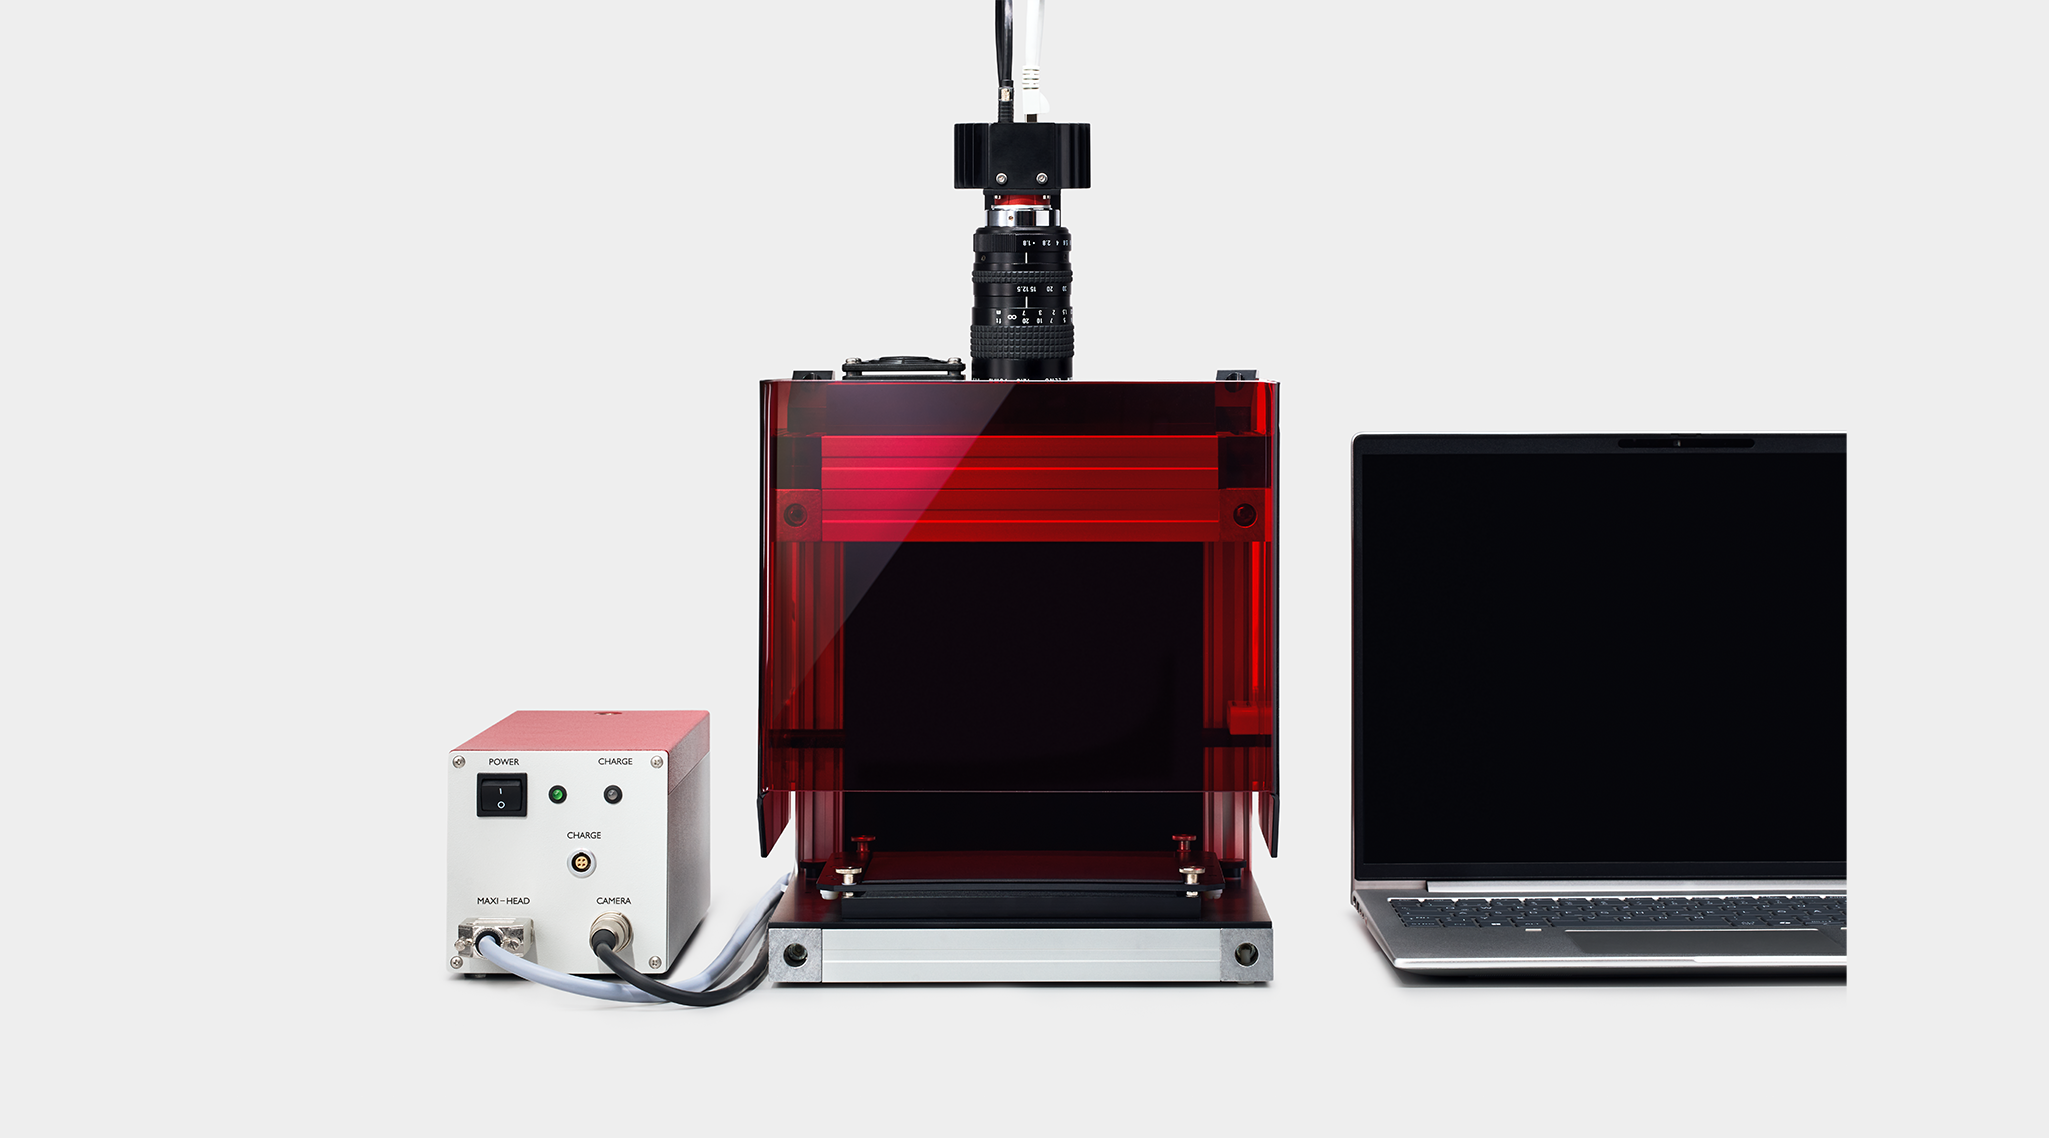
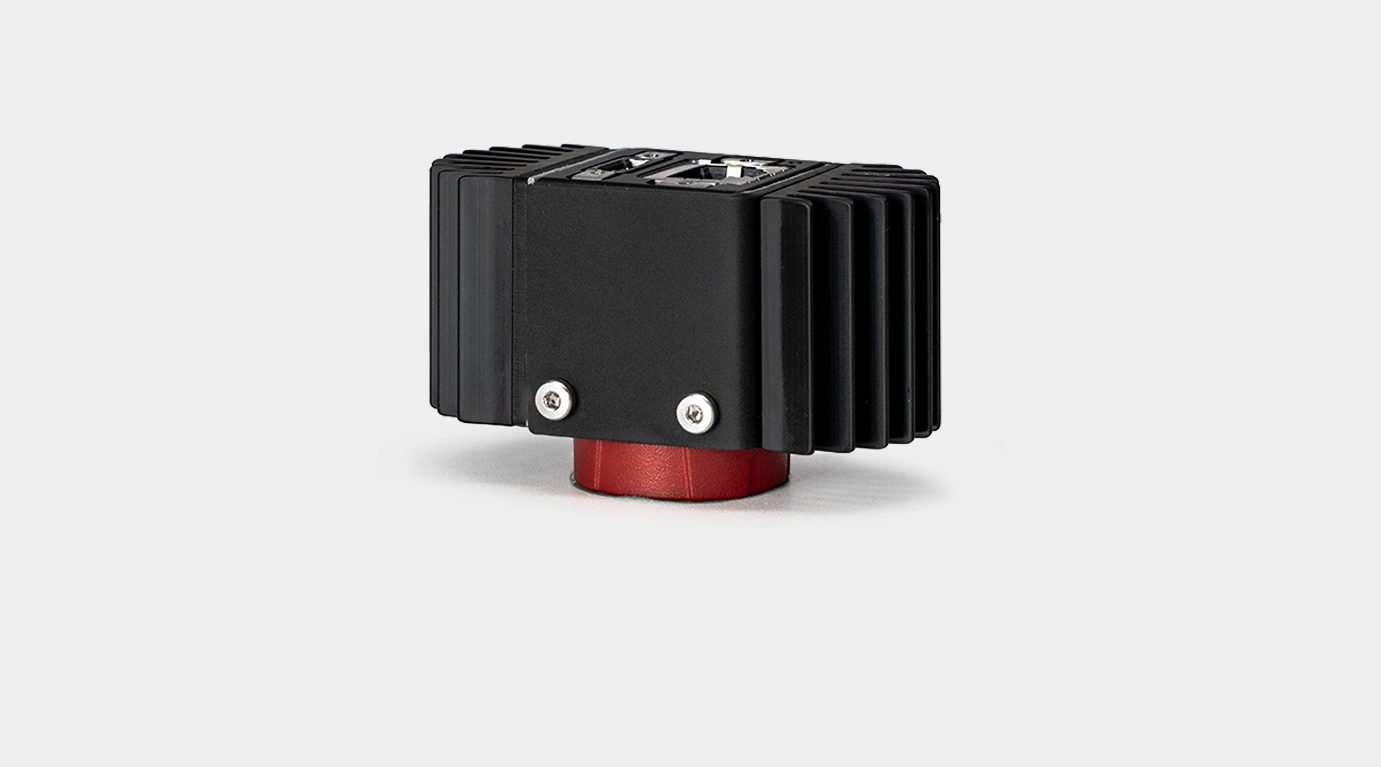
IMAG-K9
Camera with 1/1.2” CMOS chip
Water
Field
Laboratory